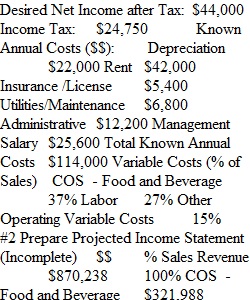
Q Bottoms Up Approach to Pricing Worksheet and Notes Managerial Accounting - MGT 225 Problem #1- Bottoms Up Pricing Using Net Income After Tax as a cost: Profit is the bottom line goal of an operation, therefore profit represents the excess sales revenue after deduction of all operating costs; profit after tax can be treated as a cost and included in the operating budget. The operating budget can be developed beginning with a determined level of profit after tax and created from the bottom line of the income statement upwards, identifying all known costs and the necessary sales revenue needed to cover those costs. This technique is used to create a budget and assists in setting sales price structures. To use this technique one must assume the following: 1. Sales Revenue = 100% of the Income Statement 2. Variable Costs (food and beverage costs, labor costs, etc.) are represented as a % of Sales Revenue 3. Income Tax Rate (%) must be known 4. All Known Costs (non variable costs aka fixed costs) including net income after tax can be identified and/or estimated from historical data Calculations/Steps: 1. Identify desired net income after tax 2. Find tax of the desired net income with the tax rate known Net Income (AT) = Operating Income - Net Income (AT) = Income Tax 1 - Tax Rate (%) 3. Identify Known Operating Costs (Annual) $$Dollar 4. Identify Variable Costs as a % of Sales Revenue 5. Solve for Sales Revenue needed to cover all costs and achieve desired net income after tax Known Costs $$ (includes Desired Net Income) = Sales Revenue Needed 100% - Variable Cost % Practice Problem #1 • Desired Net Income = 20% Return from a $220,000 investment in FF&E • Income Tax Rate = 36% of Operating Income (BT) • Depreciation 10% of $220,000 • Annual Costs = Rent = 42,000, Insurance/License=5,400, Utilities/Maintenance=6,800, Administrative=12,200, Management Salary=25,600 • Variable Costs = 37% Food, 27% Labor, 15% Other • 100 Seats (40% Lunch / 60% Dinner - Sales Revenue Mix), 2.5 Turns for Lunch, 1.5 Turns for Dinner, Open 312 Days per Year #1 Identify Projected Costs Desired Net Income after Tax: Income Tax: Known Annual Costs ($$): Depreciation Rent Insurance /License Utilities/Maintenance Administrative Management Salary Total Known Annual Costs Variable Costs (% of Sales) COS - Food and Beverage Labor Other Operating Variable Costs #2 Prepare Projected Income Statement (Incomplete) $$ % Sales Revenue Unknown 100% COS - Food and Beverage Labor Other Operating VC Total Variable Cost % Depreciation Rent Insurance /License Utilities/Maintenance Administrative Management Salary Income Tax Net Income Total Total Costs as a % Sales Rev 100% #3 Prepare Condensed Projected Income Statement Sales Revenue Variable Costs (Food, Bev, Labor, Other) Contribution Margin Total Operating Costs Operating Income (BT) Income Tax Net Income #4 Solve for Average Check Projections by Meal Period to support projected Sales Revenue Knowing the forecasted sales revenue allows businesses to accurately forecast overall average check and average check by meal period. This is critical information needed for the budgeting process and selecting strategic pricing strategies. Average Check by Meal Period = (Revenue generated from meal period / Seats x T/O x number days open) Seat Turnover = # guests or covers / # seats in operation or available (Can be calculated by Meal Period or Day) ? Practice Problem #2: • Desired Net Income: Owners want a 23% after tax return on a $250,000 investment of new FF&E • Income Tax Rate: 37% of operating income before tax • Depreciation of 10% of the book value of the $250,000 0f FF&E • Annual Costs: Rent=$50,000, Insurance/Licenses=$6,000, Utilities/Maintenance=$7,500, Administrative=$15,500, Management Salary=$40,000 • Variable Costs=COS Food and Beverage 41% (Too High!), Labor=31%, Other=6% #1 Identify Projected Costs Desired Net Income after Tax: Income Tax: Known Annual Costs ($$): Depreciation Rent Insurance /License Utilities/Maintenance Administrative Management Salary Total Known Annual Costs Variable Costs (% of Sales) COS - Food and Beverage Labor Other Operating Variable Costs #2 Prepare Projected Income Statement (Incomplete) $$ % Sales Revenue Unknown 100% COS - Food and Beverage Labor Other Operating VC Total Variable Cost % Depreciation Rent Insurance /License Utilities/Maintenance Administrative Management Salary Income Tax Net Income Total Total Costs as a % Sales Rev 100% #3 Prepare Condensed Projected Income Statement Sales Revenue Variable Costs (Food, Bev, Labor, Other) Contribution Margin Total Operating Costs Operating Income (BT) Income Tax Net Income #4 Solve for Average Check Projections by Meal Period to support projected Sales Revenue Knowing the forecasted sales revenue allows businesses to accurately forecast overall average check and average check by meal period. This is critical information needed for the budgeting process and selecting strategic pricing strategies. Average Check by Meal Period = (Revenue generated from meal period / Seats x T/O x number days open) Seat Turnover = # guests or covers / # seats in operation or available (Can be calculated by Meal Period or Day) Practice Problem #3: Net Income Required: 55,555 Tax Rate= 33% Depreciation on Asset 20% of 95,000 Book Value Known Costs = Insurance = 4500, License = 2500, Utilities=11000, Maintenance=4000, Administrative = 14000, Salaries=52000 Variable Costs = 33.5% Food Cost, 36.5% Wage Cost and 12% other Variable Cost 365 days,85 seats, Lunch Seat TO= 1.75, Dinner Seat TO=2.1 Sales = 65% Dinner and 35% Lunch #1 Identify Projected Costs Desired Net Income after Tax: Income Tax: Known Annual Costs ($$): Depreciation Rent Insurance /License Utilities/Maintenance Administrative Management Salary Total Known Annual Costs Variable Costs (% of Sales) COS - Food and Beverage Labor Other Operating Variable Costs #2 Prepare Projected Income Statement (Incomplete) $$ % Sales Revenue Unknown 100% COS - Food and Beverage Labor Other Operating VC Total Variable Cost % Depreciation Rent Insurance /License Utilities/Maintenance Administrative Management Salary Income Tax Net Income Total Total Costs as a % Sales Rev 100% #3 Prepare Condensed Projected Income Statement Sales Revenue Variable Costs (Food, Bev, Labor, Other) Contribution Margin Total Operating Costs Operating Income (BT) Income Tax Net Income #4 Solve for Average Check Projections by Meal Period to support projected Sales Revenue Knowing the forecasted sales revenue allows businesses to accurately forecast overall average check and average check by meal period. This is critical information needed for the budgeting process and selecting strategic pricing strategies. Average Check by Meal Period = (Revenue generated from meal period / Seats x T/O x number days open) Seat Turnover = # guests or covers / # seats in operation or available (Can be calculated by Meal Period or Day)
View Related Questions